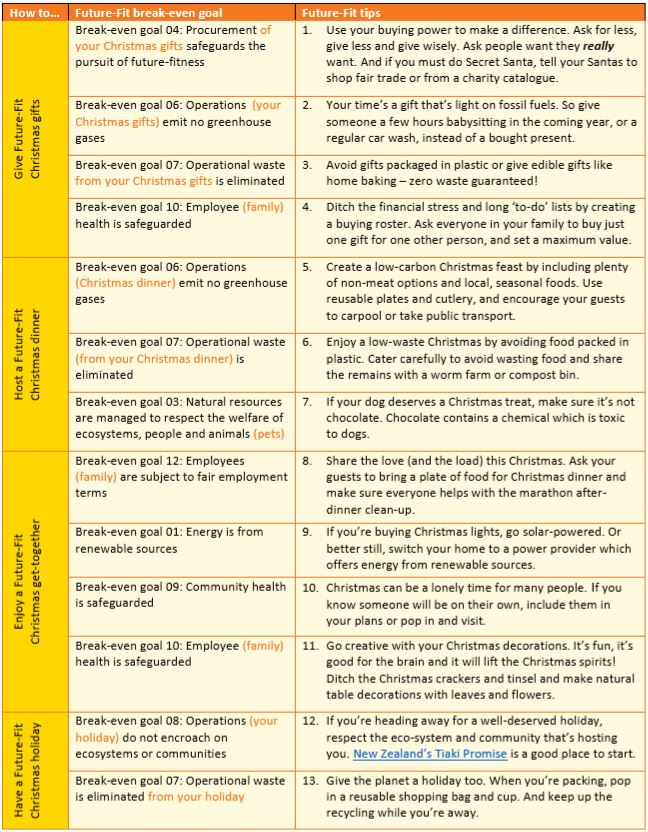
Our FY23 GHG (Carbon) Emissions Footprint
Our FY23 carbon footprint is a ‘transitional’ footprint given the merger with Apollo businesses. To capture as much data as possible, we took a materiality approach to include the larger sites in our footprint which now covers approximately 85% of our total combined sites. Excluded sites include three sites in the UK / Ireland, three newly acquired Action Manufacturing sites and two Australian dealership sites. Scope 1 and 2 emissions for specific sites across Canada, Australia, the UK and Ireland have been included as partial years from date of acquisition.
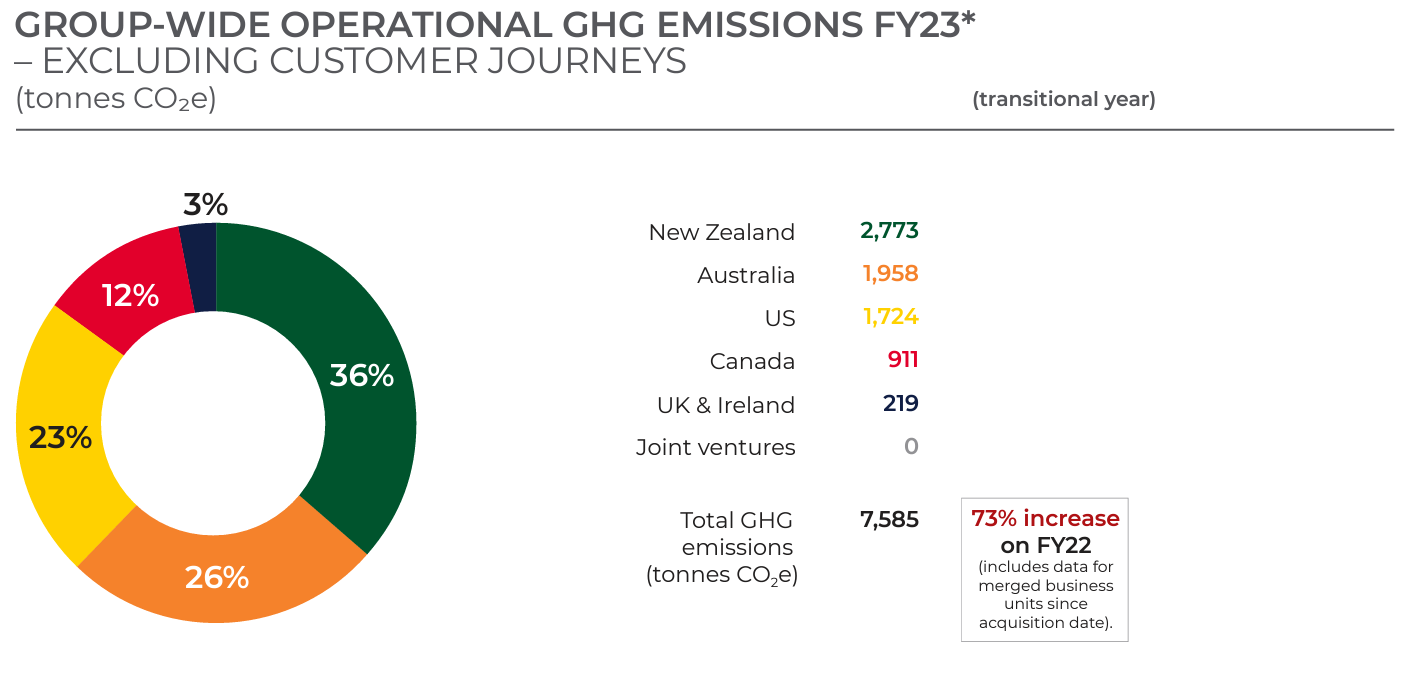
Our transitional footprint continues to be based on our previous approach (full Scope 1 and 2 and limited Scope 3), keeping to a FY19 baseline for consistency with previous years, with customer journeys included in our Scope 1 emissions. Our total transitional footprint as a much larger merged business is 65,472 tCO2e, an increase of approximately 60% from FY22. This includes data for merged business units since date of acquisition. This footprint includes an increase in our operational emissions of 73% from FY22 (an increase of 4% from our FY19 baseline year), and also an increase in our customer journey emissions of 58% from FY22 (a decrease of 22% from our FY19 baseline year).
Prior to the merger, our intention was to extend our FY23 footprint to include our full Scope 3 emissions. However, given the additional data required from Apollo businesses, we will instead be restating our entire greenhouse gas inventory in FY24, to include full Scope 1, 2 and 3 emissions. FY24 will then become our new baseline year, which will enable us to refine our science-aligned target as discussed in the Climate & Carbon Strategy section in our FY23 Integrated Annual Report.
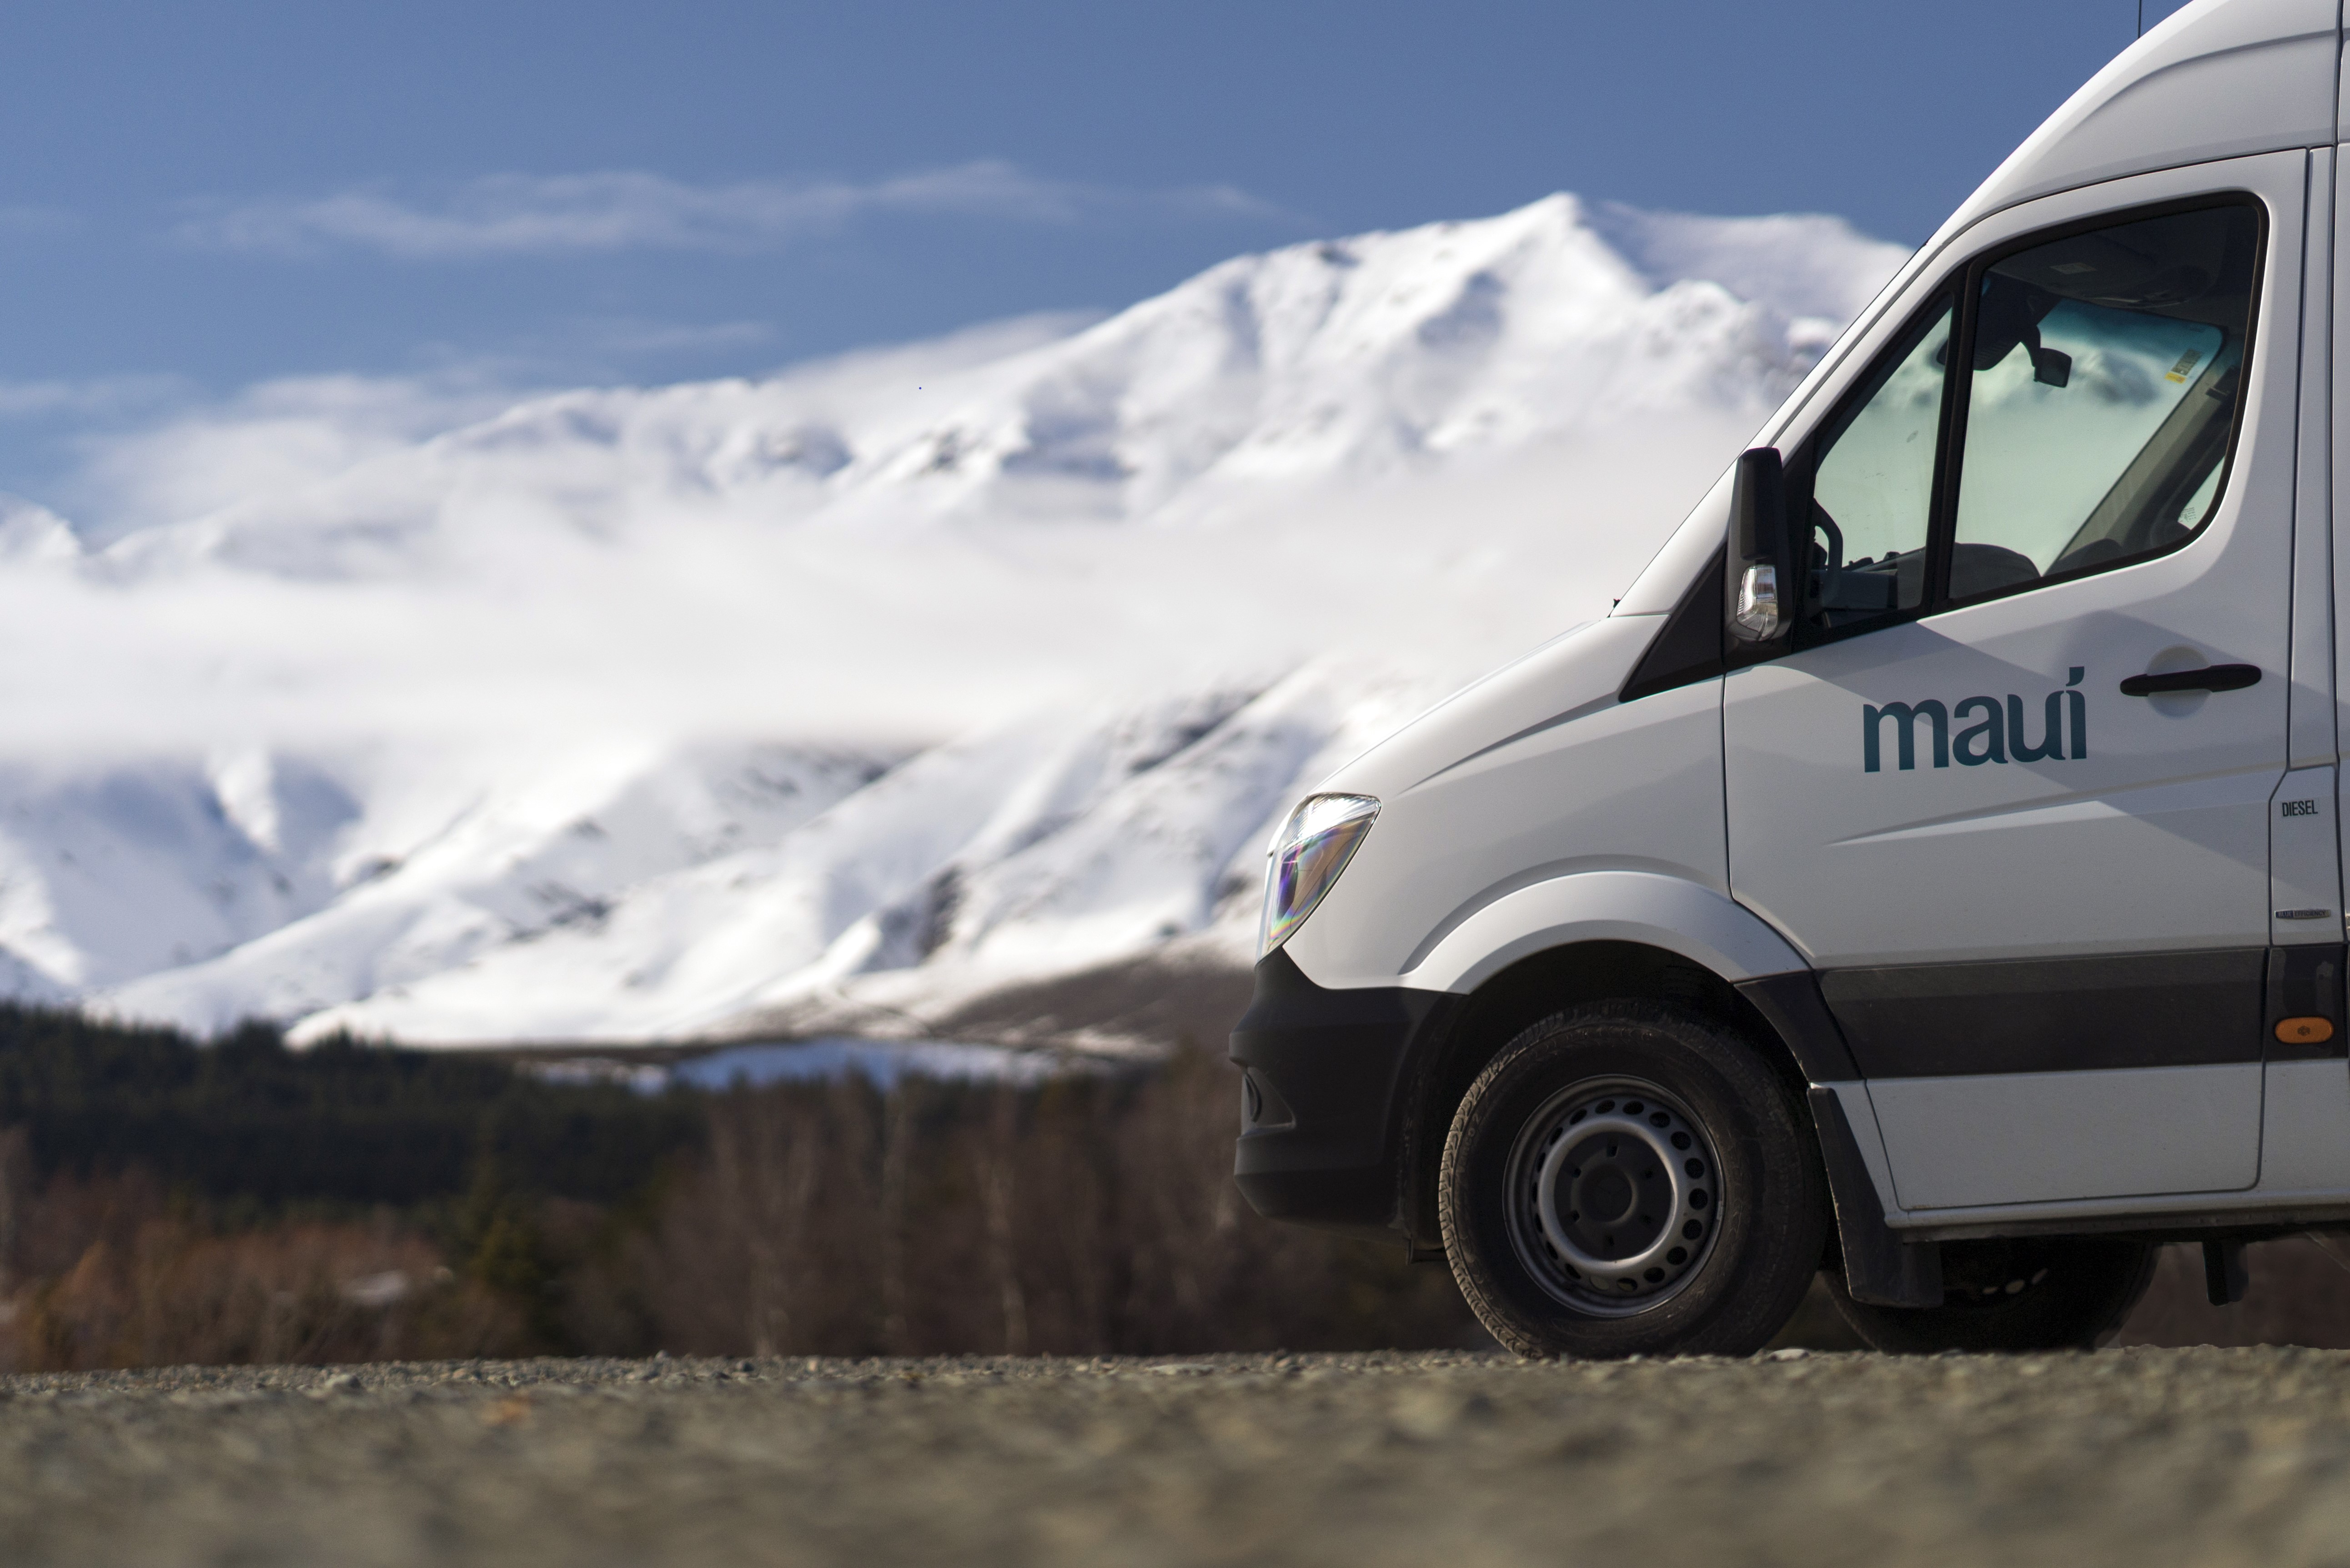
In the following graphs we have included customer journey emissions in Scope 1 but have also reported them separately for consistency with previous years. As international visitors return to New Zealand, Kiwi Experience has restarted after a period of hibernation and we have seen a corresponding increase in their emissions and from our Discover Waitomo tourism operations.
GHG emissions by country


GHG emissions by scope

GHG emissions by business unit
 .
.
GHG emissions by source